Reporting Overview
- Print
Reporting Overview
- Print
Article summary
Did you find this summary helpful?
Thank you for your feedback!
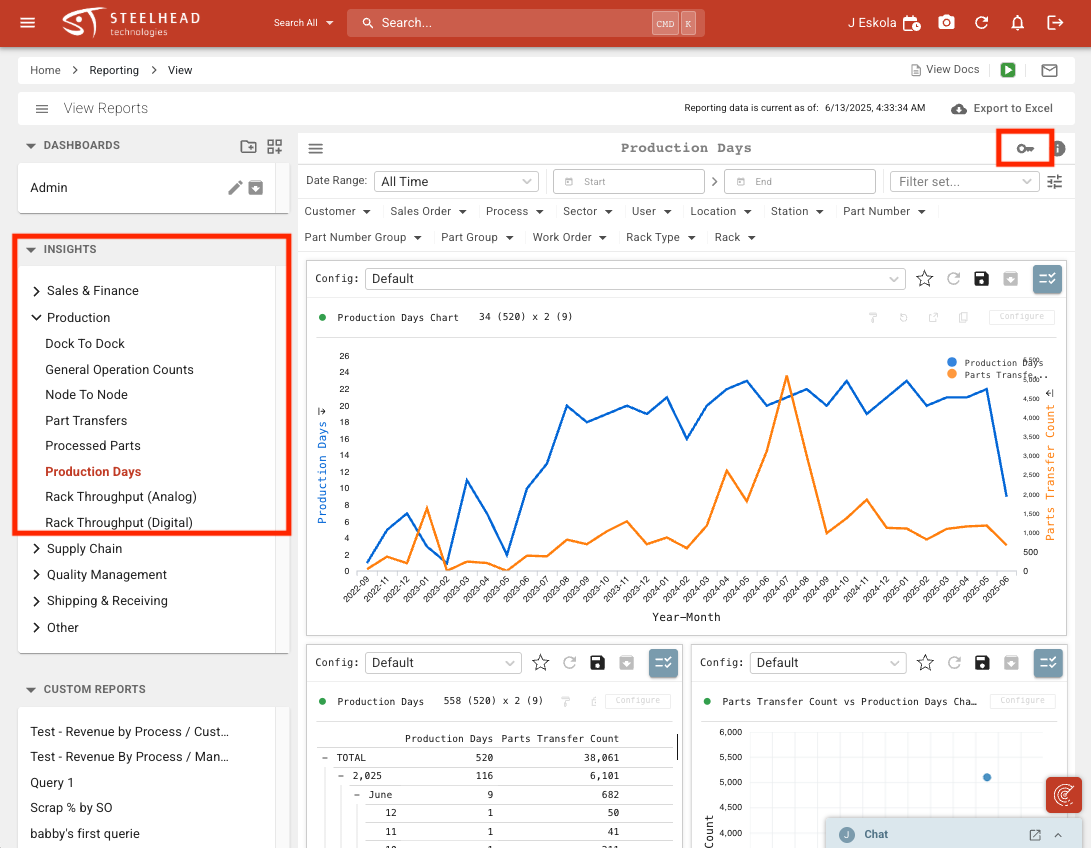
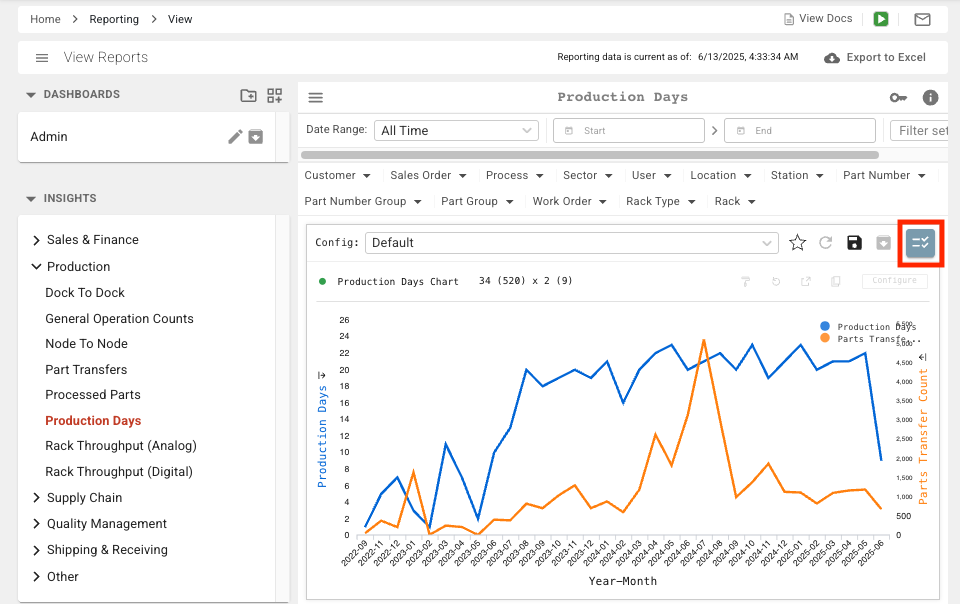
Reporting and Insights in Steelhead can quickly give you valuable information on your company's production data ("Insights" are specific reports that we've pre-formatted for convenience). You can easily set up customized Dashboards depending on your goals and needs, then Steelhead automatically pulls the critical data for you to easily review it at any time.
Follow the walkthrough below, or see the video overview here.
- Navigate to the Reporting dashboard from the Administration Section of your Steelhead homepage.
Set Permissions
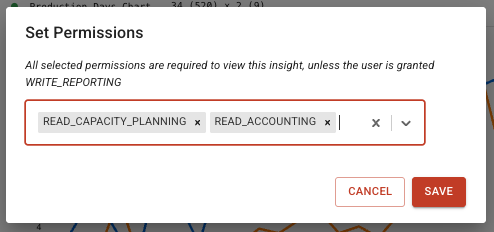
- To Set Permissions you wish to require to see specific Reports:
Select a Report under Insights. Click on the Key to set the permissions for that Report.
You must have Write_Reporting Permissions turned on in order to set these permissions.
Select as many Permissions as desired.
Click SAVE.
Configure Data
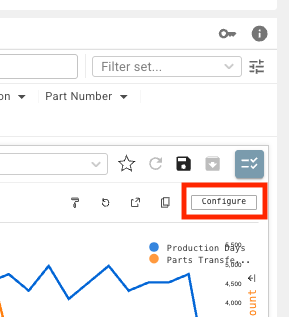
- You can also configure data in different ways and save each configuration, then easily switch between views.
Click on the Configure button.
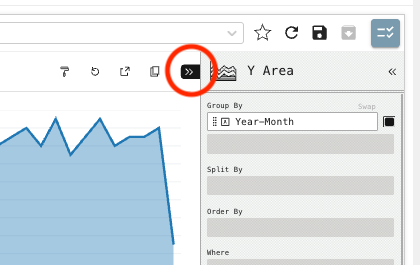
Change configurations as desired, then click the arrow to collapse the Configuration menu.
Click the Save icon.
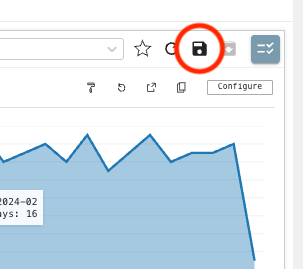
Enter a Configuration Name, then click SAVE AS NEW, or update the existing configuration.
Now you can toggle between the different configurations by clicking the drop-down next to the Configuration name.
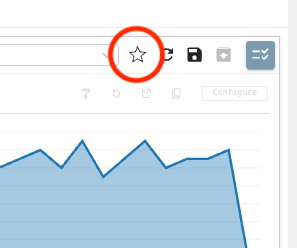
Save as Default
You can also save a Configuration as the Default by clicking the Star icon.
Create Dashboards and Folders
Note: Reporting Dashboards may be displayed in Carousels, along with Steelhead Dashboards and Maintenance Dashboards. See the article on Carousels for more information.
- Click the Create Dashboard button to start customizing your own views.
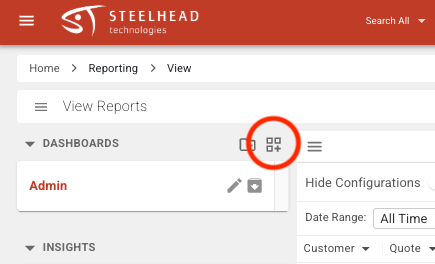
Give the dashboard a name and click CREATE. Click the Folder icon to create a dashboard folder and organize your dashboards further.
Click the drop-down next to the folder name to open a folder, then click and drag dashboards to put them into a folder.
Add Data to Dashboards
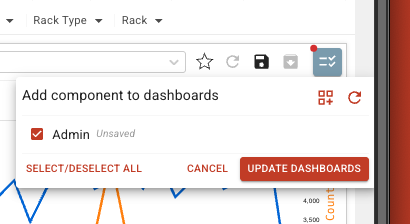
Click the Add to Dashboard icon to add data to customized dashboards.
Select any dashboards you'd like to add to, then click UPDATE DASHBOARDS.
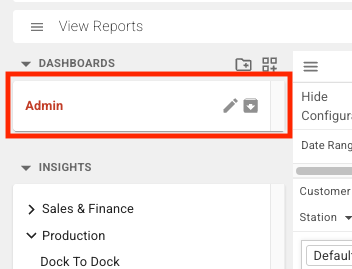
Click on the dashboard name to view or configure it. Click the edit pencil icon to rename, and the down arrow file box icon to archive it.
Customize Dashboards
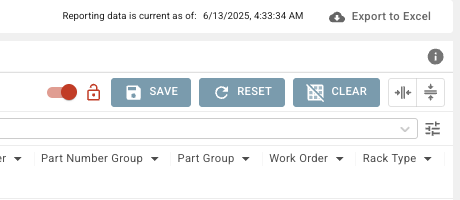
Use the Lock/Unlock toggle to reorganize the dashboard as desired. Click and drag to resize charts and move them around.
Use RESET and CLEAR buttons to revert.
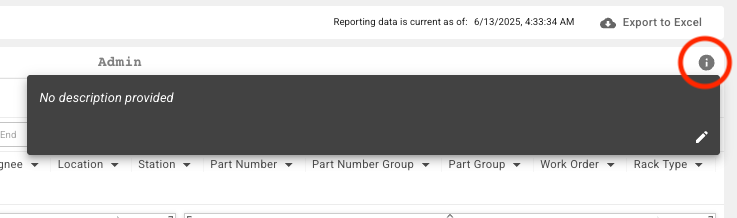
Add a Tooltip Report Description
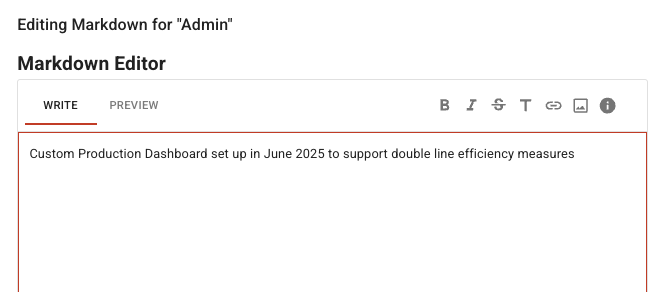
Click the "i" information icon to open the Dashboard tooltip, then click the pencil to edit.
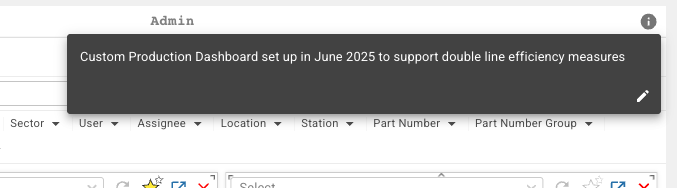
Add your custom description and click SAVE.
Your text will show when a User hovers over the tooltip.
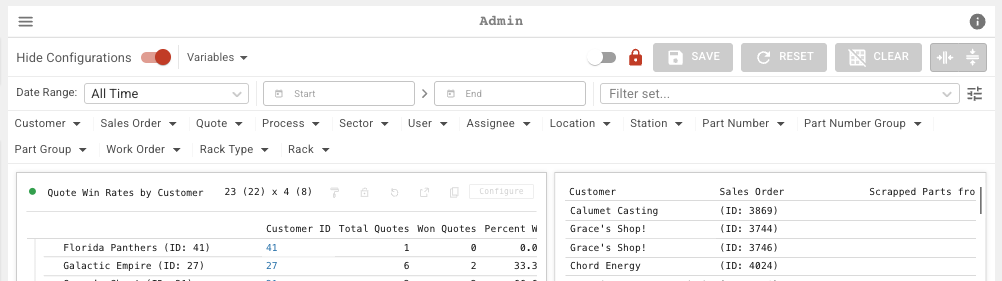
Switch the toggle to Hide/Show Configurations:
Shown:

Hidden:
We hope this helps you quickly and easily organize your company data so that you can gain insight into what's happening in your shop and make informed decisions that move you towards your shop's goals.
Was this article helpful?