Supply Chain Insights Reports
- Print
Supply Chain Insights Reports
- Print
Article summary
Did you find this summary helpful?
Thank you for your feedback!
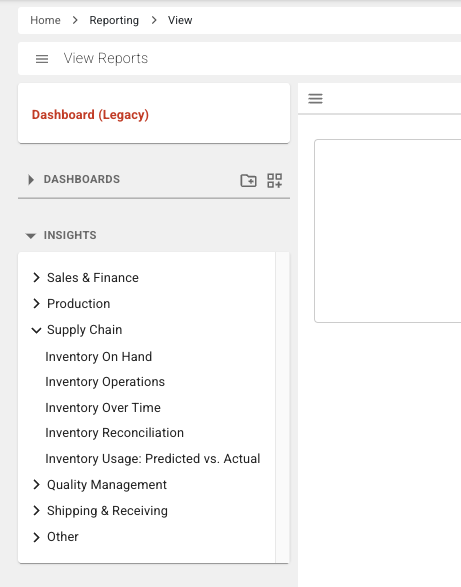
These reports are available to view and modify under the Insights drop-down menu in the Reporting Dashboard, from the Administration Section of the Homepage:
Inventory on Hand
Inventory Operations
Inventory Over Time
Inventory Reconciliation
Inventory Usage: Predicted vs. Actual
Inventory on Hand
This report shows an overview of all current Inventory.
Inventory Operations
This report shows an overview of all Inventory creations and depletions.
Inventory Over Time
This report shows the state of Inventory for each month.
Date Range: Filters to show Inventory changes within the selected period. Cumulative quantities will be calculated starting from the beginning of the selected range.
Inventory Reconciliation
This report shows all Inventory transactions.
Inventory Usage: Predicted vs. Actual
The Inventory Usage: Predicted vs Actual report shows the predicted and actual usage of Inventory items for Work Orders broken down by treatment.
Predicted Inventory usage is calculated using the part number Inventory usage multiplied by the number of Parts that were treated.
Actual Inventory usage is calculated using the Inventory depletions against the Work Order.
The default table titled "Work Orders With Depletions And Treated Parts" shows only Work Orders that have both depletions and treated Parts. This table is useful for comparing predicted and actual usages at a Work Order level.
The default table titled "All Depletions with Treated Parts" shows all Inventory items that have both depletions and treated Parts. This table is useful for comparing predicted and actual usages when depletions are not made against Work Orders.
In the default chart titled "Work Orders With Depletions And Treated Parts By Month", the predicted and actual usages are grouped by the Work Order creation month.
Mean Absolute Error (MAE) and Mean Absolute Percentage Error (MAPE) are methods used to calculate the accuracy of predicted usages. Lower values indicate higher accuracy, with 0 representing perfect accuracy. If many Parts are missing predicted usages, MAE might be a more suitable choice over MAPE.
In the default chart titled "Treatments With Depletions and Treated Parts", the relative accuracy of predicted usages per treatment is shown.
Date Range: Filters to show Parts transfers and Inventory transfers within the selected period.
Was this article helpful?