Dashboards
- Print
Dashboards
- Print
Article summary
Did you find this summary helpful?
Thank you for your feedback!
Dashboards are configurable visual representations of workload in your shop. By providing an overview of where jobs are being worked in relation to one another, Dashboards can provide visibility into potential bottlenecks and delays as well as opportunities for downtime or maintenance. They can also provide instant information about the progress of a particular job.
Create Dashboards to get a quick summary of where your Work Orders are. For example, you might create a "Plant Overview" Dashboard for a high level overview of where orders are on the floor, or an "Anodize Department" Dashboard to track orders through your anodizing Stations.
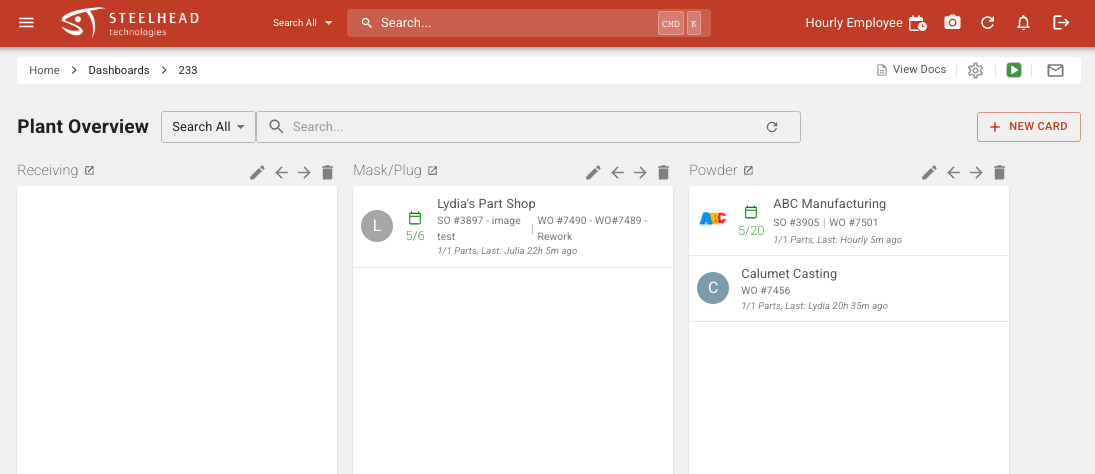
Plant Overview Dashboard:
A centralized plant management Dashboard provides real-time insights into production metrics, inventory levels, and order status. The Dashboard enables decision-makers to monitor performance and identify areas for improvement.
Create Dashboards
To create a Dashboard, click the Dashboards Tile in the Production Section of the Homepage. Then click +NEW DASHBOARD. Give it a name to reflect the area of production you'd like it to show, such as "Plant Overview" or "Shipping/Receiving." Click SAVE. Now you can click the name of the Dashboard to open it, and use +NEW CARD to add Process Node work summaries to the Dashboard. See Create a New Dashboard Card for more information.
Searching Dashboards
The search bar in the Dashboards Menu is one way used to locate specific Dashboards. Options are included to search by Work Orders, Sales Orders, Part Numbers, Customers, Treatments, Process, Location, or Search All.
Navigating Dashboards
Since your plant can hold many types of Treatment Stations, you can create as many different Dashboard Cards as you like. They can also be edited and rearranged on your screen as needed. Additionally, each Card has a full screen view option if this view is preferred by the User.
Full Screen Card View
Clicking the Expand icon next to the name of a Dashboard Card will open the full screen view. In this view there can be found a few options for arranging the Dashboard menu.

In this page three data rows are shown, and each tells different information about the Dashboard:
Card
- Shows the Name of the Dashboard Card.
- Shows how long ago the Card was created.
- Shows the Creator of the Card.
Parts
- Shows the amount of Parts on the Work Order.
- Lists relevant Work Orders in the Dashboard.
- Shows the customer of the listed parts.
- Shows the Work Order Due Date. This is set on the Work Order.
- Allows for rearranging and deletion of parts on the Card.
Transitions
- Lists Process Node transitions associated with the Dashboard Card.
Was this article helpful?